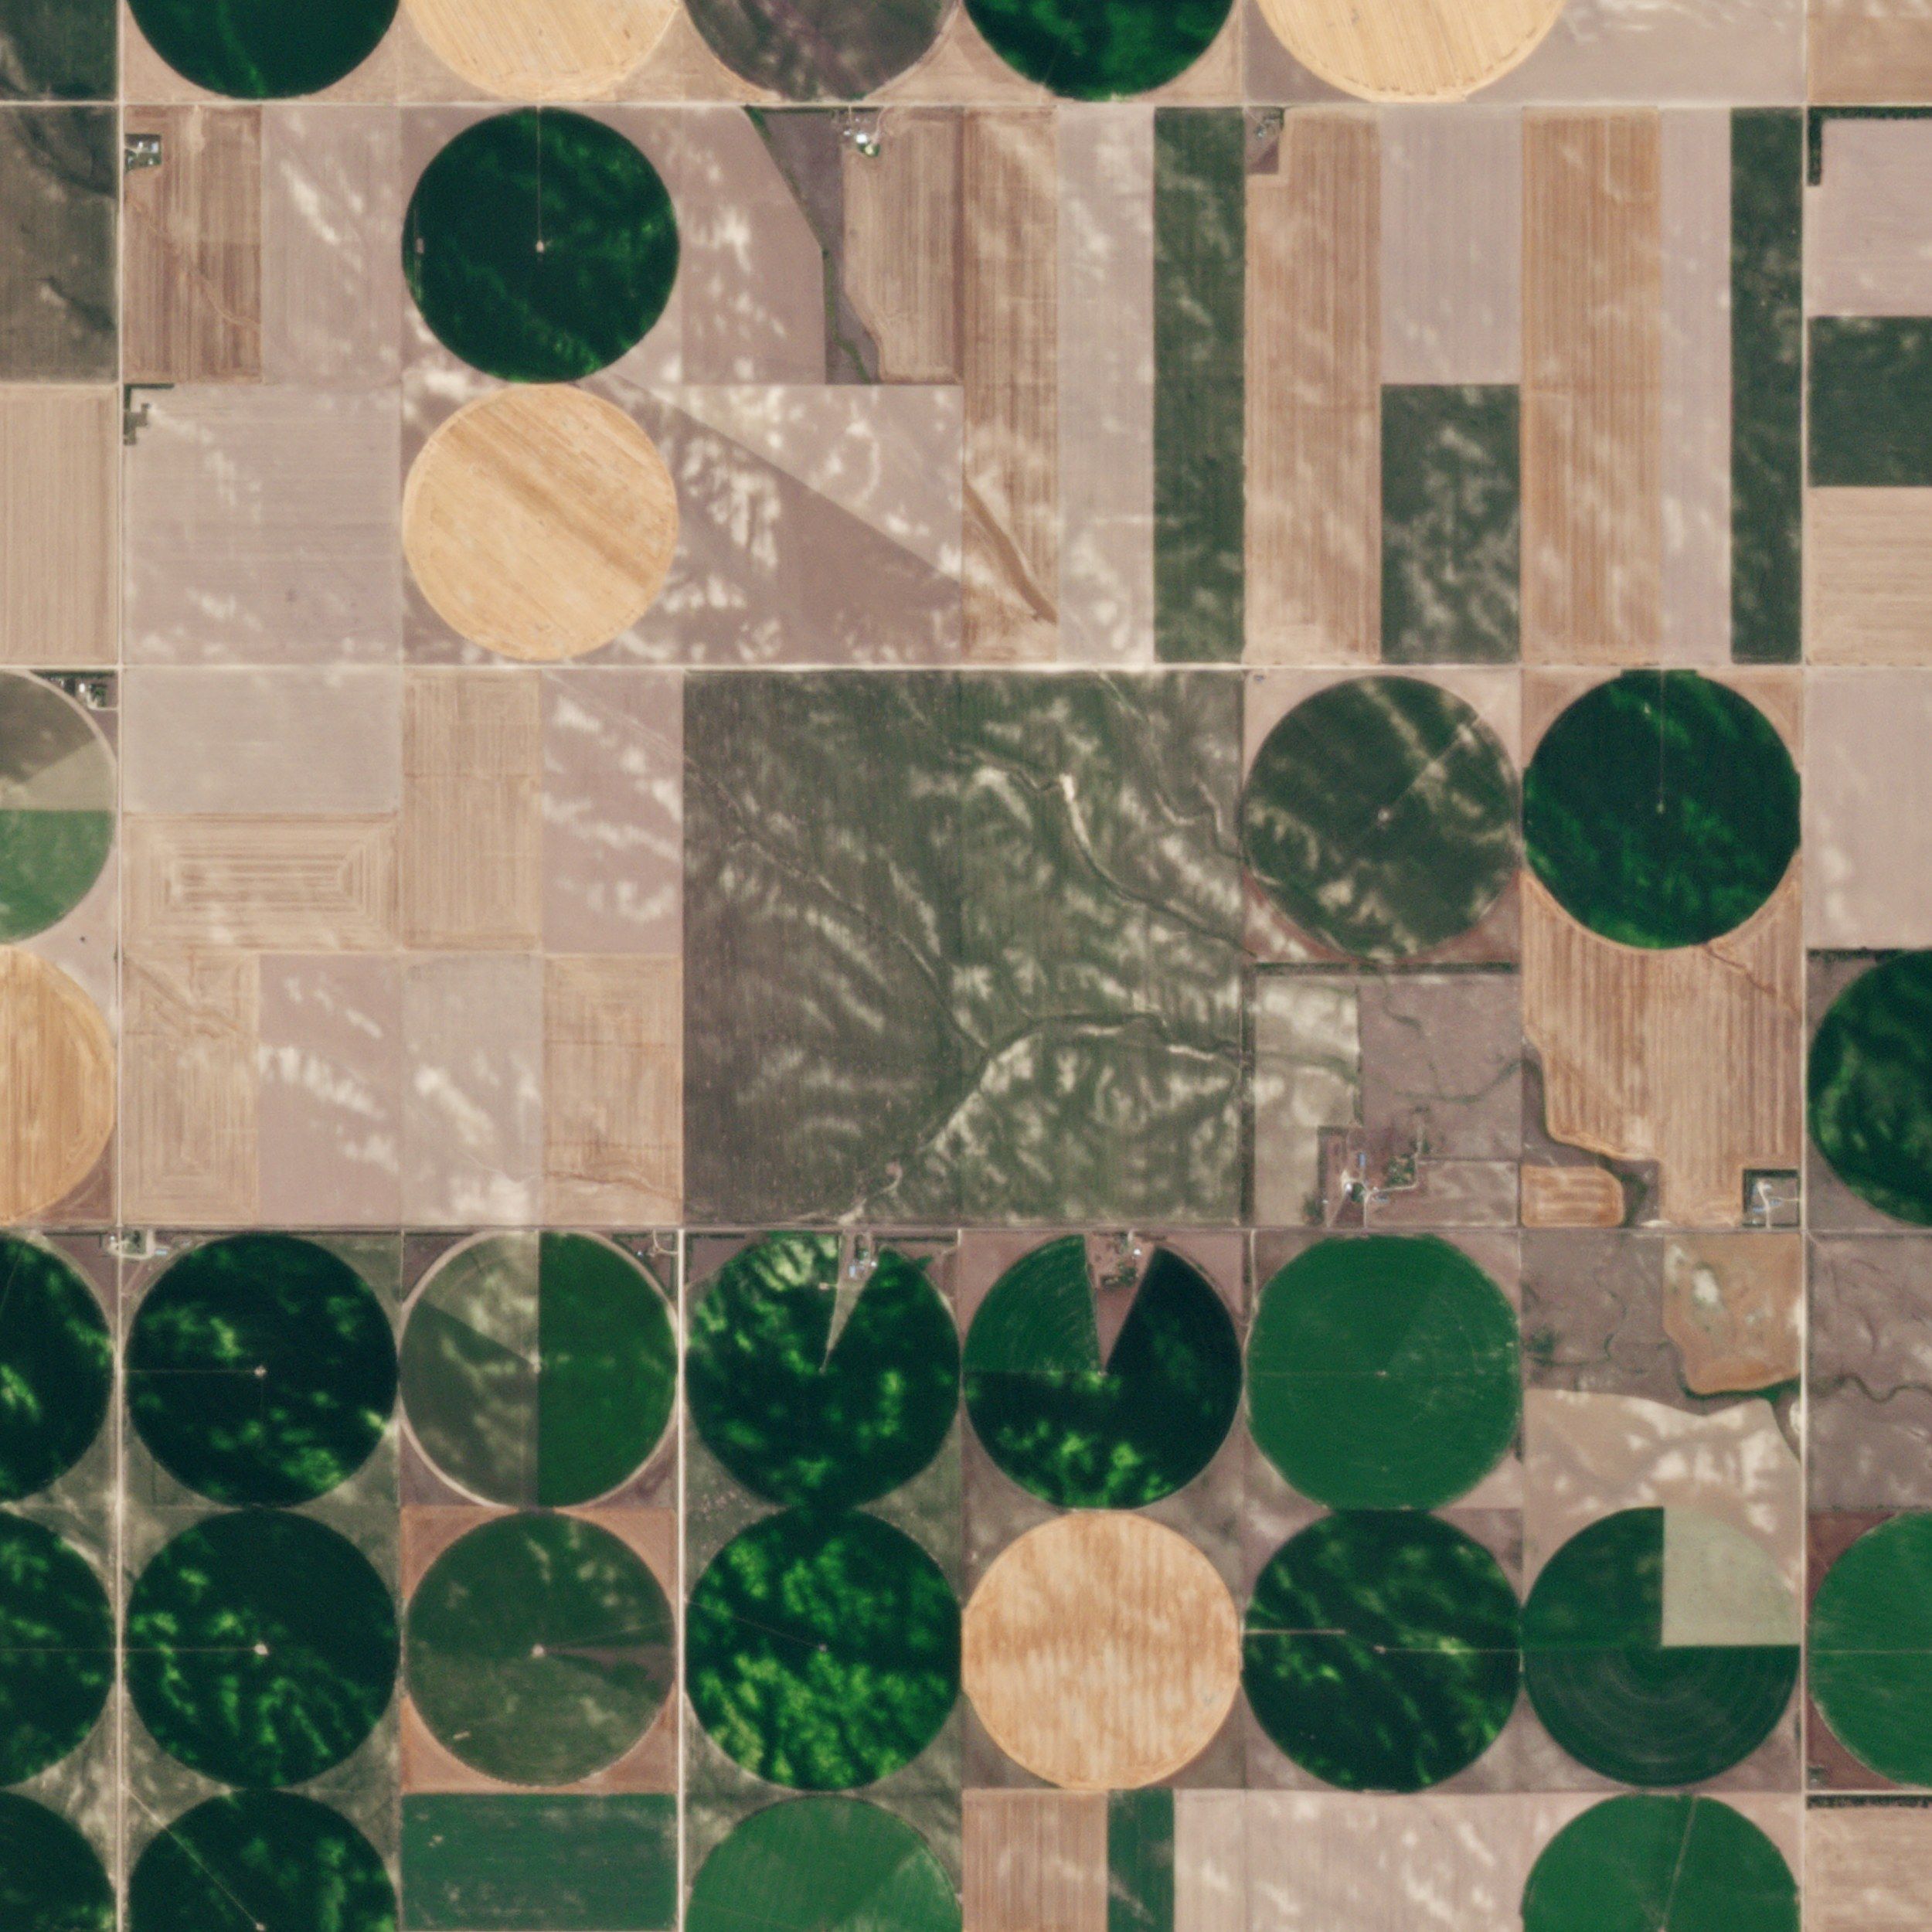
Agriculture monitoring
Vegetation indices, crop maps and parcel alerts through the season, from optical, hyperspectral, thermal and SAR imagery.
- 3 mOptical, daily · Planet
- 5 mHyperspectral · Pixxel
- 5.3 mHyperspectral · Wyvern
- 30 mThermal · constellr
Indices
| Index | Formula | Shows |
|---|---|---|
| NDVI | (NIR − Red) / (NIR + Red) | Vigour and green cover |
| NDRE | (NIR − RE) / (NIR + RE) | Chlorophyll and nitrogen in dense canopies |
| EVI | 2.5 (NIR − Red) / (NIR + 6 Red − 7.5 Blue + 1) | Vigour where NDVI saturates |
| SAVI | 1.5 (NIR − Red) / (NIR + Red + 0.5) | Early season, sparse cover over bright soil |
| NDMI | (NIR − SWIR) / (NIR + SWIR) | Water content of the canopy |
| LAI | Modelled from reflectance | Leaf area per unit of ground |
| LST | Thermal infrared | Water stress and irrigation need |
| Soil moisture | SAR backscatter | Surface moisture, through cloud |
Example
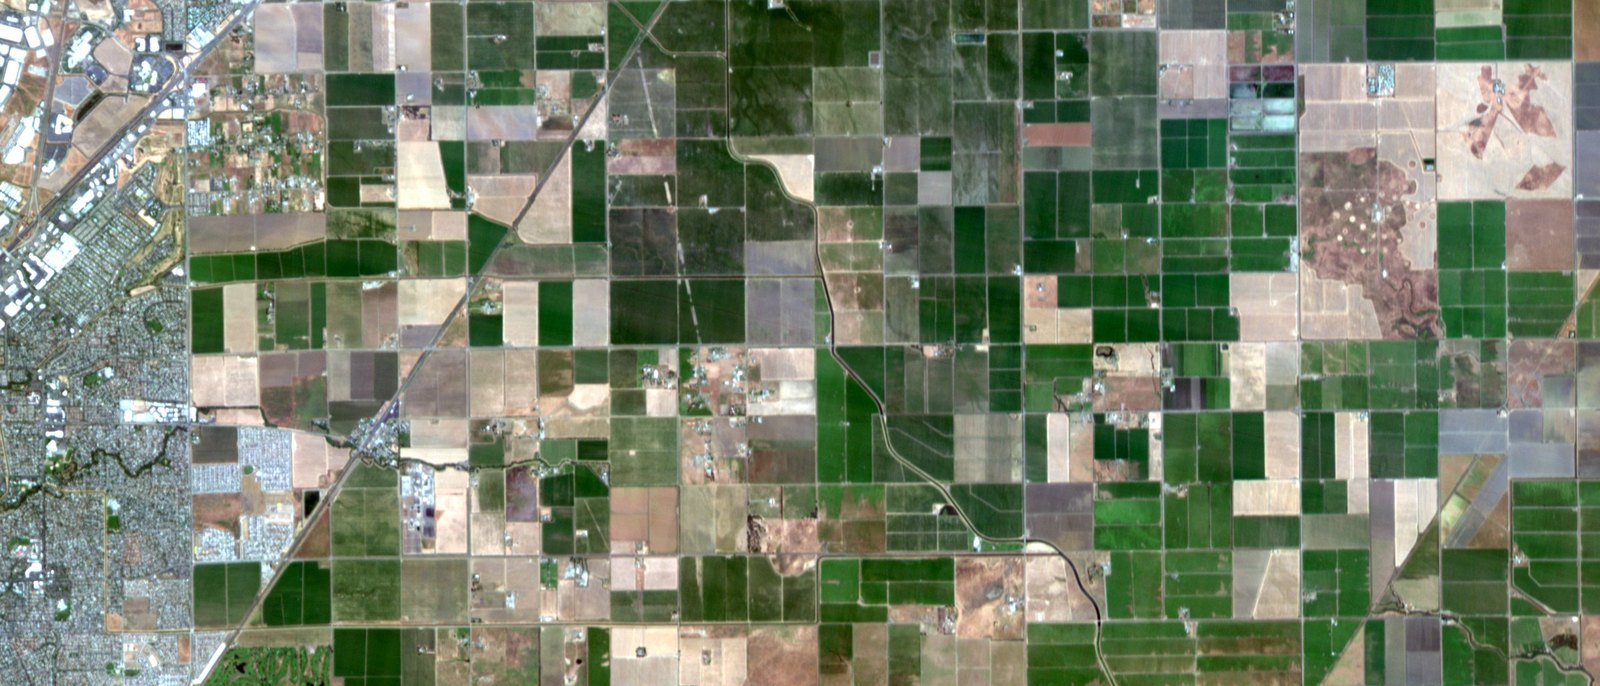
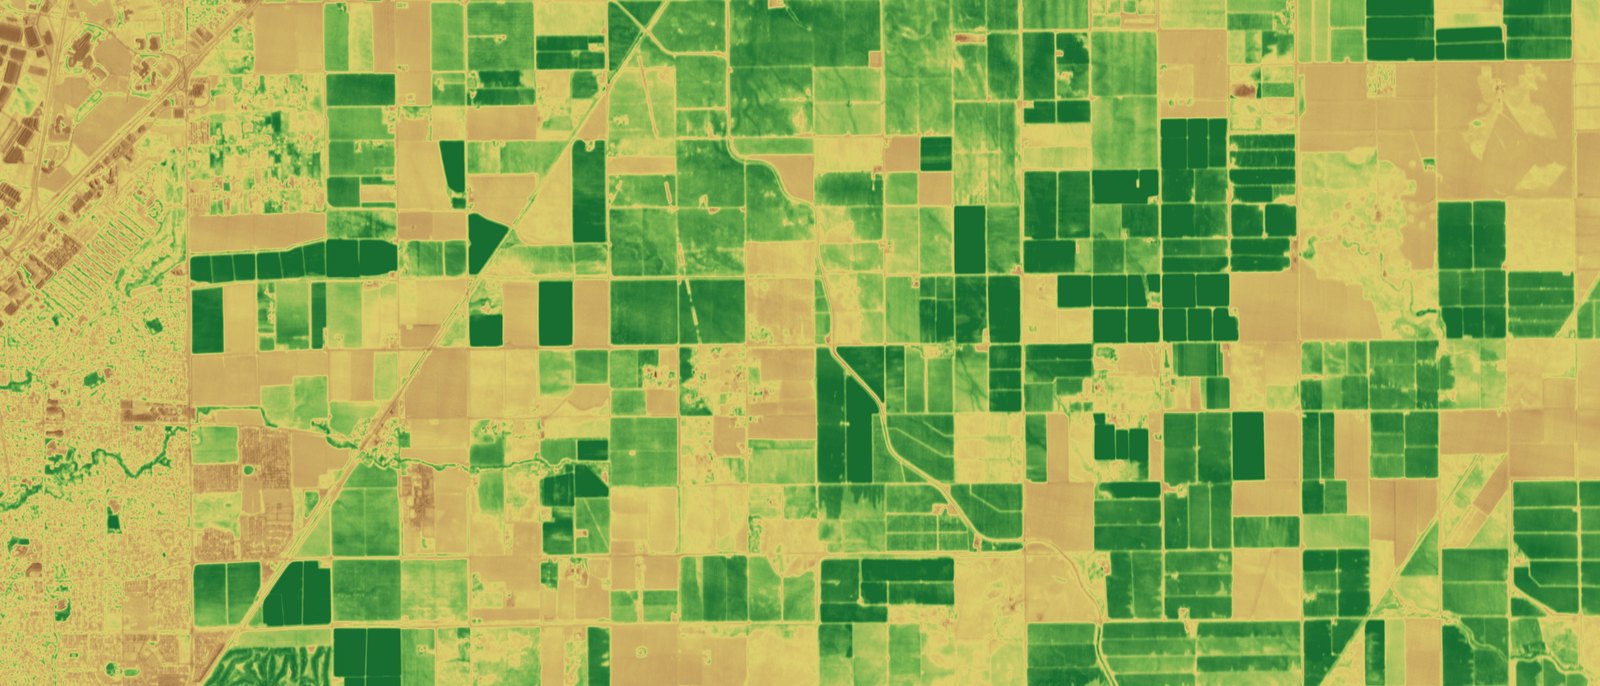
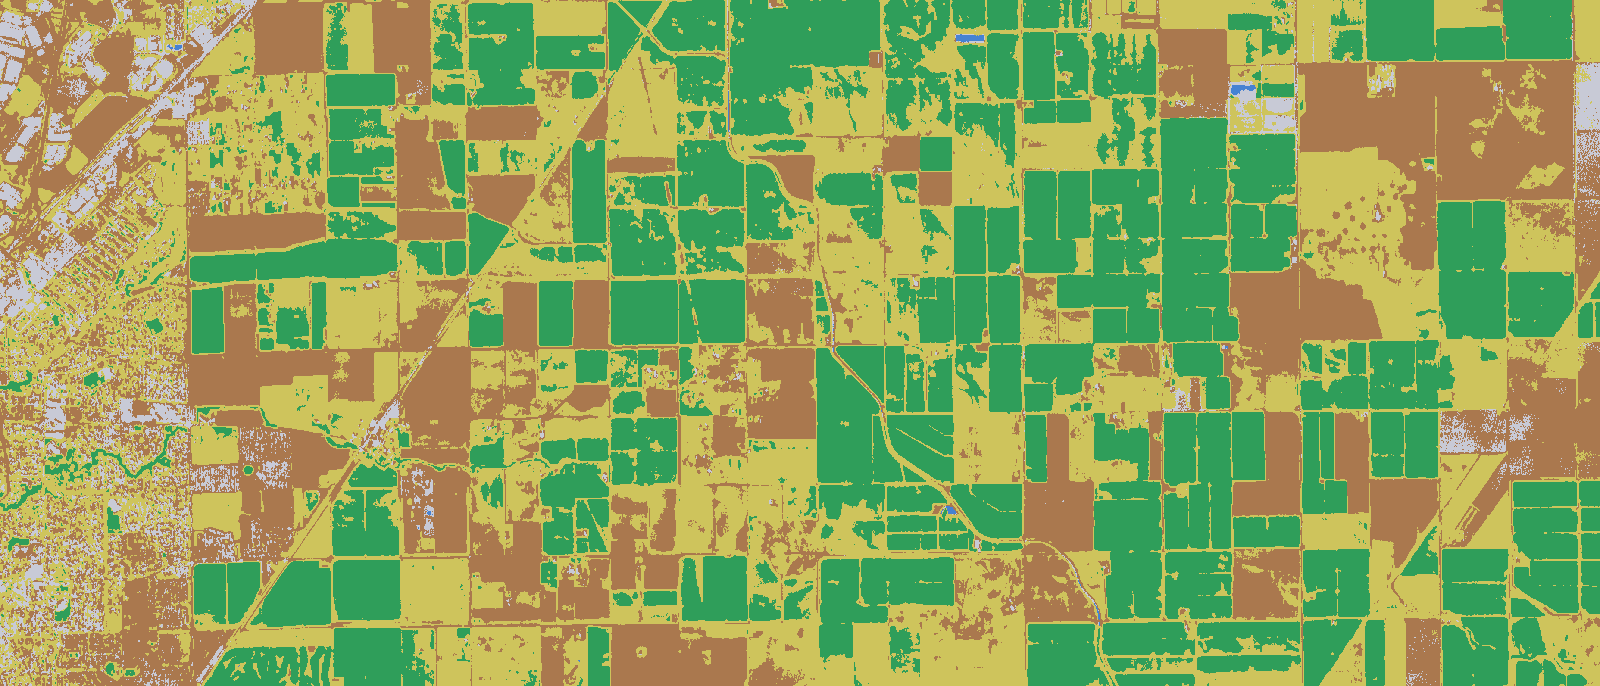
Threshold classification on a single 5.2 m scene; production maps add training data, several dates and field validation.
Outputs
- 01
Crop type maps
Parcels classified by crop from the season’s time series.
- 02
Growth curves
Index per parcel, date by date, against previous seasons.
- 03
Stress alerts
Parcels falling behind their neighbours or their own history.
- 04
Management zones
Within-field zones for variable-rate fertilising and seeding.
- 05
Irrigation
Water demand and stress from surface temperature and moisture.
- 06
CAP checks
Declared crop against observed crop; ploughing, mowing and harvest dates.
- 07
Damage assessment
Hail, flood, frost and fire damage mapped per parcel.
Season
- Sowing, planting
- Growth
- Harvest
Typical months in Greece. Imagery every few days through the growth window.
Service
- 01
Season subscription
Parcels monitored from sowing to harvest, with alerts as they happen.
- 02
Single analysis
One date or one question: a crop map, a damage extent.
- 03
Integration
Indices and alerts into your farm management system by API.
Users
- Paying agencies
- Agricultural insurers
- Cooperatives and producer groups
- Agronomists and advisers
- Food and seed companies
- Irrigation organisations
- Regional authorities
Delivery
- Index maps
- GeoTIFF, Cloud Optimized GeoTIFF, per date
- Parcel statistics
- CSV, GeoPackage
- Prescription maps
- Shapefile, ISO-XML for farm machinery
- Online
- Layers and alerts in MyView, API