totalview
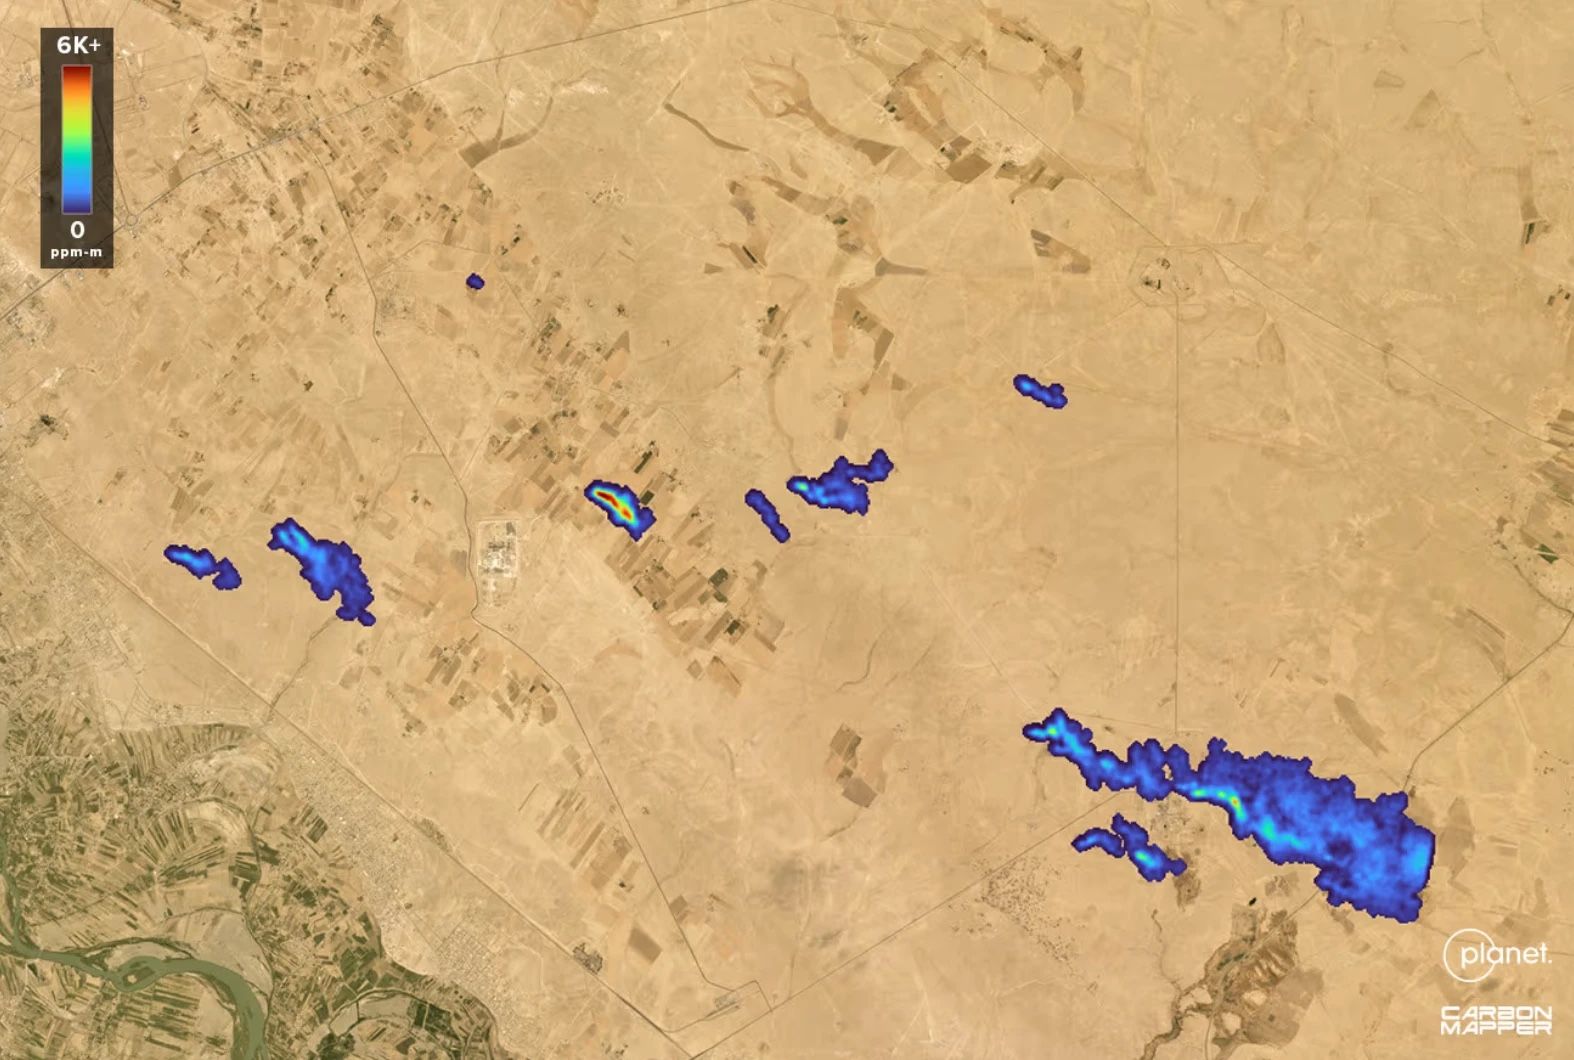
Methane plumes over arid farmland, Tanager-1 imaging spectrometer

Data

Carbon mapping

Methane and CO2 plumes at 25–30 m, attributed to the emitting facility and quantified in kg/h.

Pixel
25–30 m
Methane detection
~100 kg/h

Specifications

Pixel
25 mGHGSat · 30 m (Tanager)
Methane detection
100 kg/hGHGSat, 50% probability, 3 m/s wind · 64–126 kg/h (Tanager-1)
CO2 detection
10–19 t/hTanager-1 · 500–1,500 t/h (GHGSat Vanguard)
Spectrometer
1630–1675 nmGHGSat, ~0.3 nm · 380–2500 nm (Tanager, ~426 channels)
Coverage
12 × 12 km sceneGHGSat · 18 km swath, up to 481 km long (Tanager)
Revisit
1–2 dayspriority sites, GHGSat fleet; data within 24 h

Detection

A source’s emission rate against the published detection limits, with its yearly total and CO₂ equivalent.

1101001,00010,000100,000Methane, kg/hGHGSat aircraftTanager-1GHGSat satellitesPRISMA, EnMAP, EMITSentinel-2, LandsatSentinel-5P TROPOMI
Tanager-1 first plumes, 2024
Emission rate
Per year
CO2e, 100-year
CO2e, 20-year

Published limits under each source’s own conditions. CO2e: IPCC AR6, fossil methane.

Bands

Methane absorbs weakly at 1.65 µm and strongly at 2.3 µm. The weak band needs sub-nanometre resolution; the strong one does not.

150017001900210023002500CO2 1.61 µmCH4 1.65 µmCO2 2.06 µmCH4 2.3 µmGHGSatTanager, from 380 nm
1630–1675 nm
Spectral resolution
Samples, 1630–1675 nm
Range
Bands read

Pixel

The same plume at 25 m, 30 m and 5.5 × 7 km. A large pixel averages it into the background.

52000 ppb
Peak pixel, ΔXCH4
Plume above 100 ppb

Model: steady Gaussian plume, neutral stability, 3 × 2 km frame. Enhancement above background.

Operators

San Francisco, United States
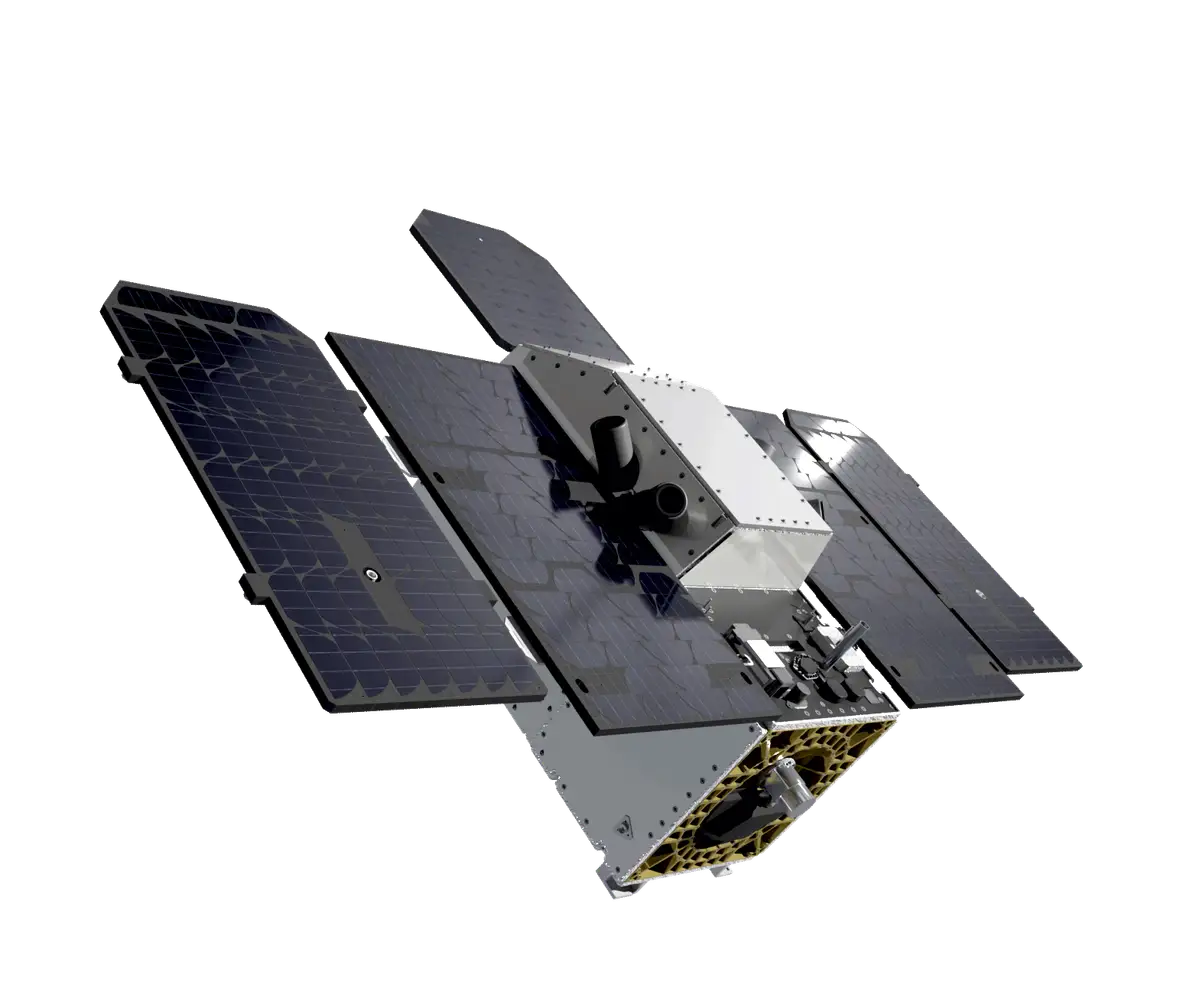
Tanager satellite
Satellite
Tanager-1, launched 16 August 2024
Instrument
JPL imaging spectrometer, ~426 channels, 380–2500 nm
Pixel · swath
30 m · 18 km
Methane
64–126 kg/h detection limit
CO2
10–19 t/h detection limit
Orbit
~430 km, sun-synchronous
First year
5,392 methane and 1,234 CO2 plumes
Next
Tanager-2, no earlier than October 2026

Provider page →
Montréal, Canada
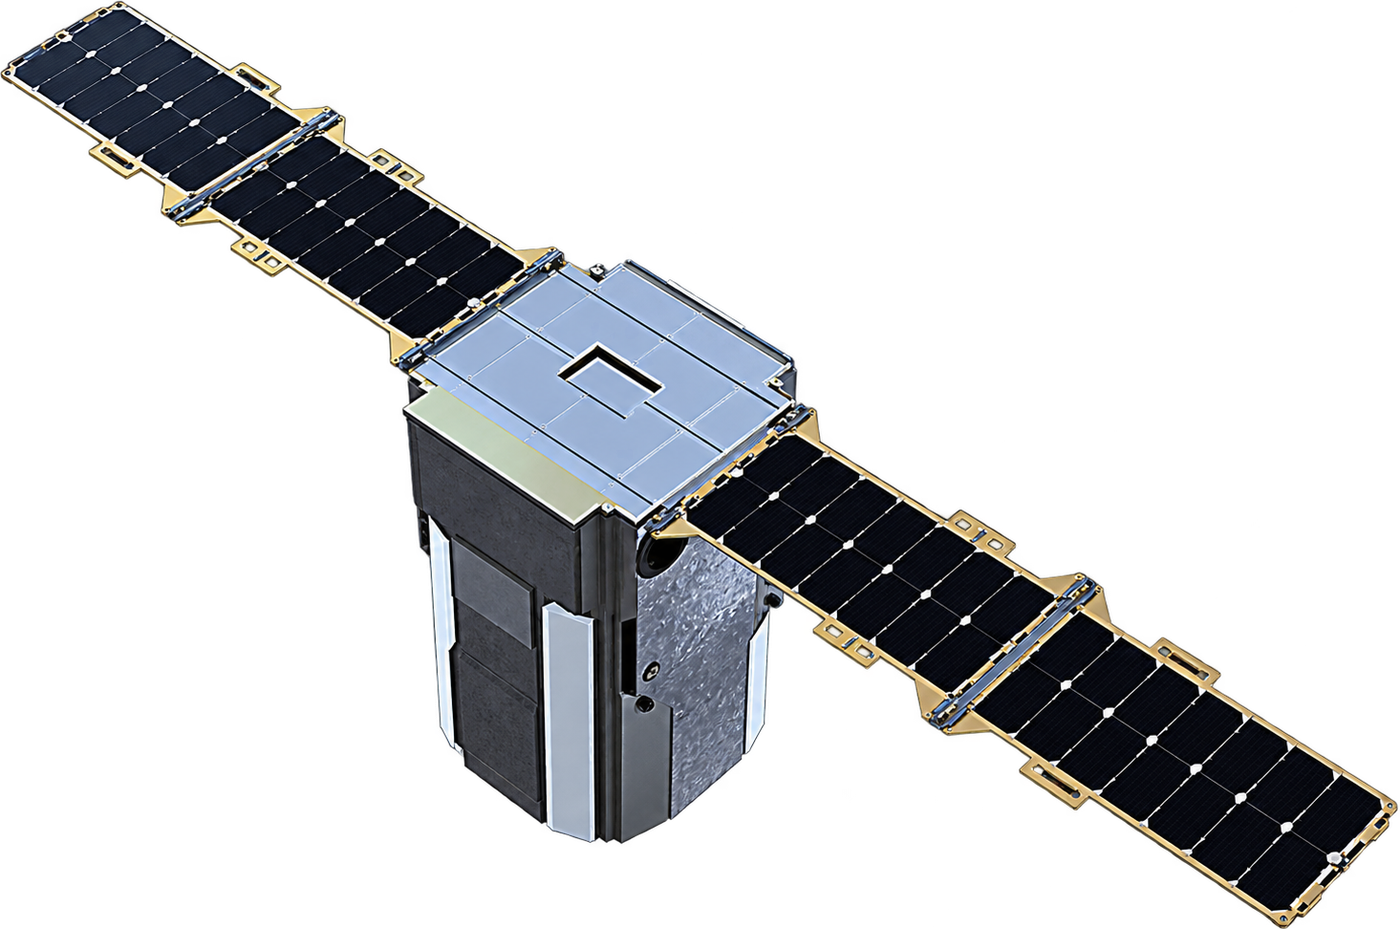
GHGSat satellite on the Spire 16U bus
Fleet
18 launched since 2016: Claire, C1–C17
Instrument
Fabry-Pérot SWIR spectrometer, 1630–1675 nm
Pixel · scene
~25 m · 12 × 12 km
Methane
100 kg/h at 50% probability
CO2
Vanguard (C10), since November 2023
Orbit
~500 km, sun-synchronous
2025
2.93 million facility measurements
Next
C18 and C19, later in 2026
Provider page →

Launches

One circle per satellite launched. Tanager-2 is at the launch site for Transporter-18.

  • GHGSat18
  • Tanager1
20162017201820192020202120222023202420252026GHGSatTanager

Gallery

Select a frame to open it at full resolution.

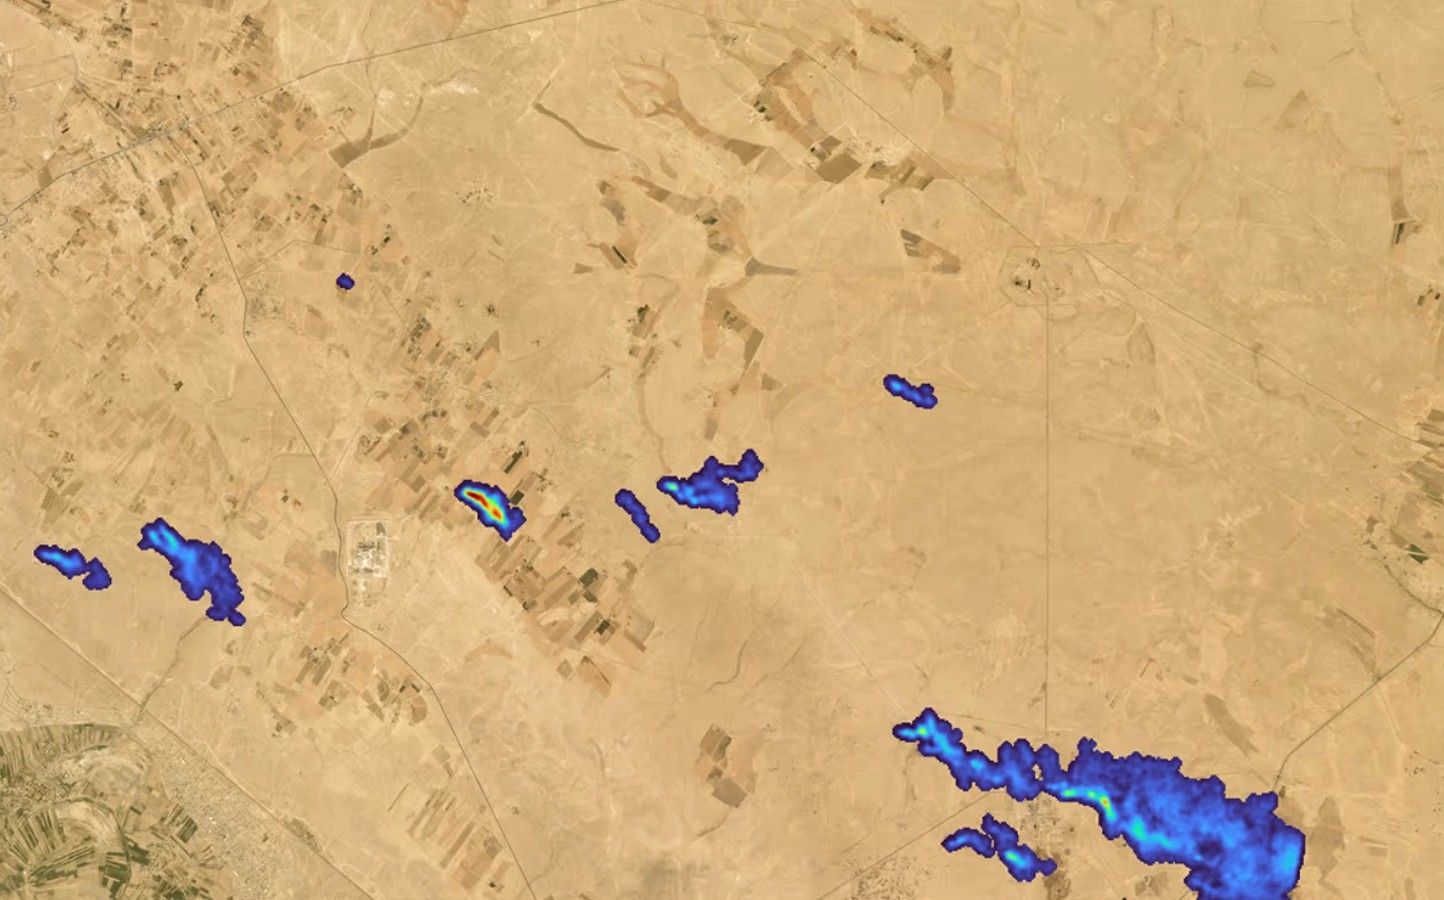
Several methane plumes over arid farmland, Tanager-1

Detects

  • Methane from oil and gas sites, coal mines, landfills and industry
  • The emitting facility, not only the region around it
  • Emission rate in kg/h, from the plume and the wind
  • CO2 from power stations and heavy industry (Tanager, GHGSat Vanguard)

Limits

  • Needs sunlight and a clear sky: no night, no cloud
  • Leaks below about 60–100 kg/h need aircraft (GHGSat airborne: 3.5 kg/h)
  • Offshore only in sun-glint geometry
  • Rates depend on the wind estimate used