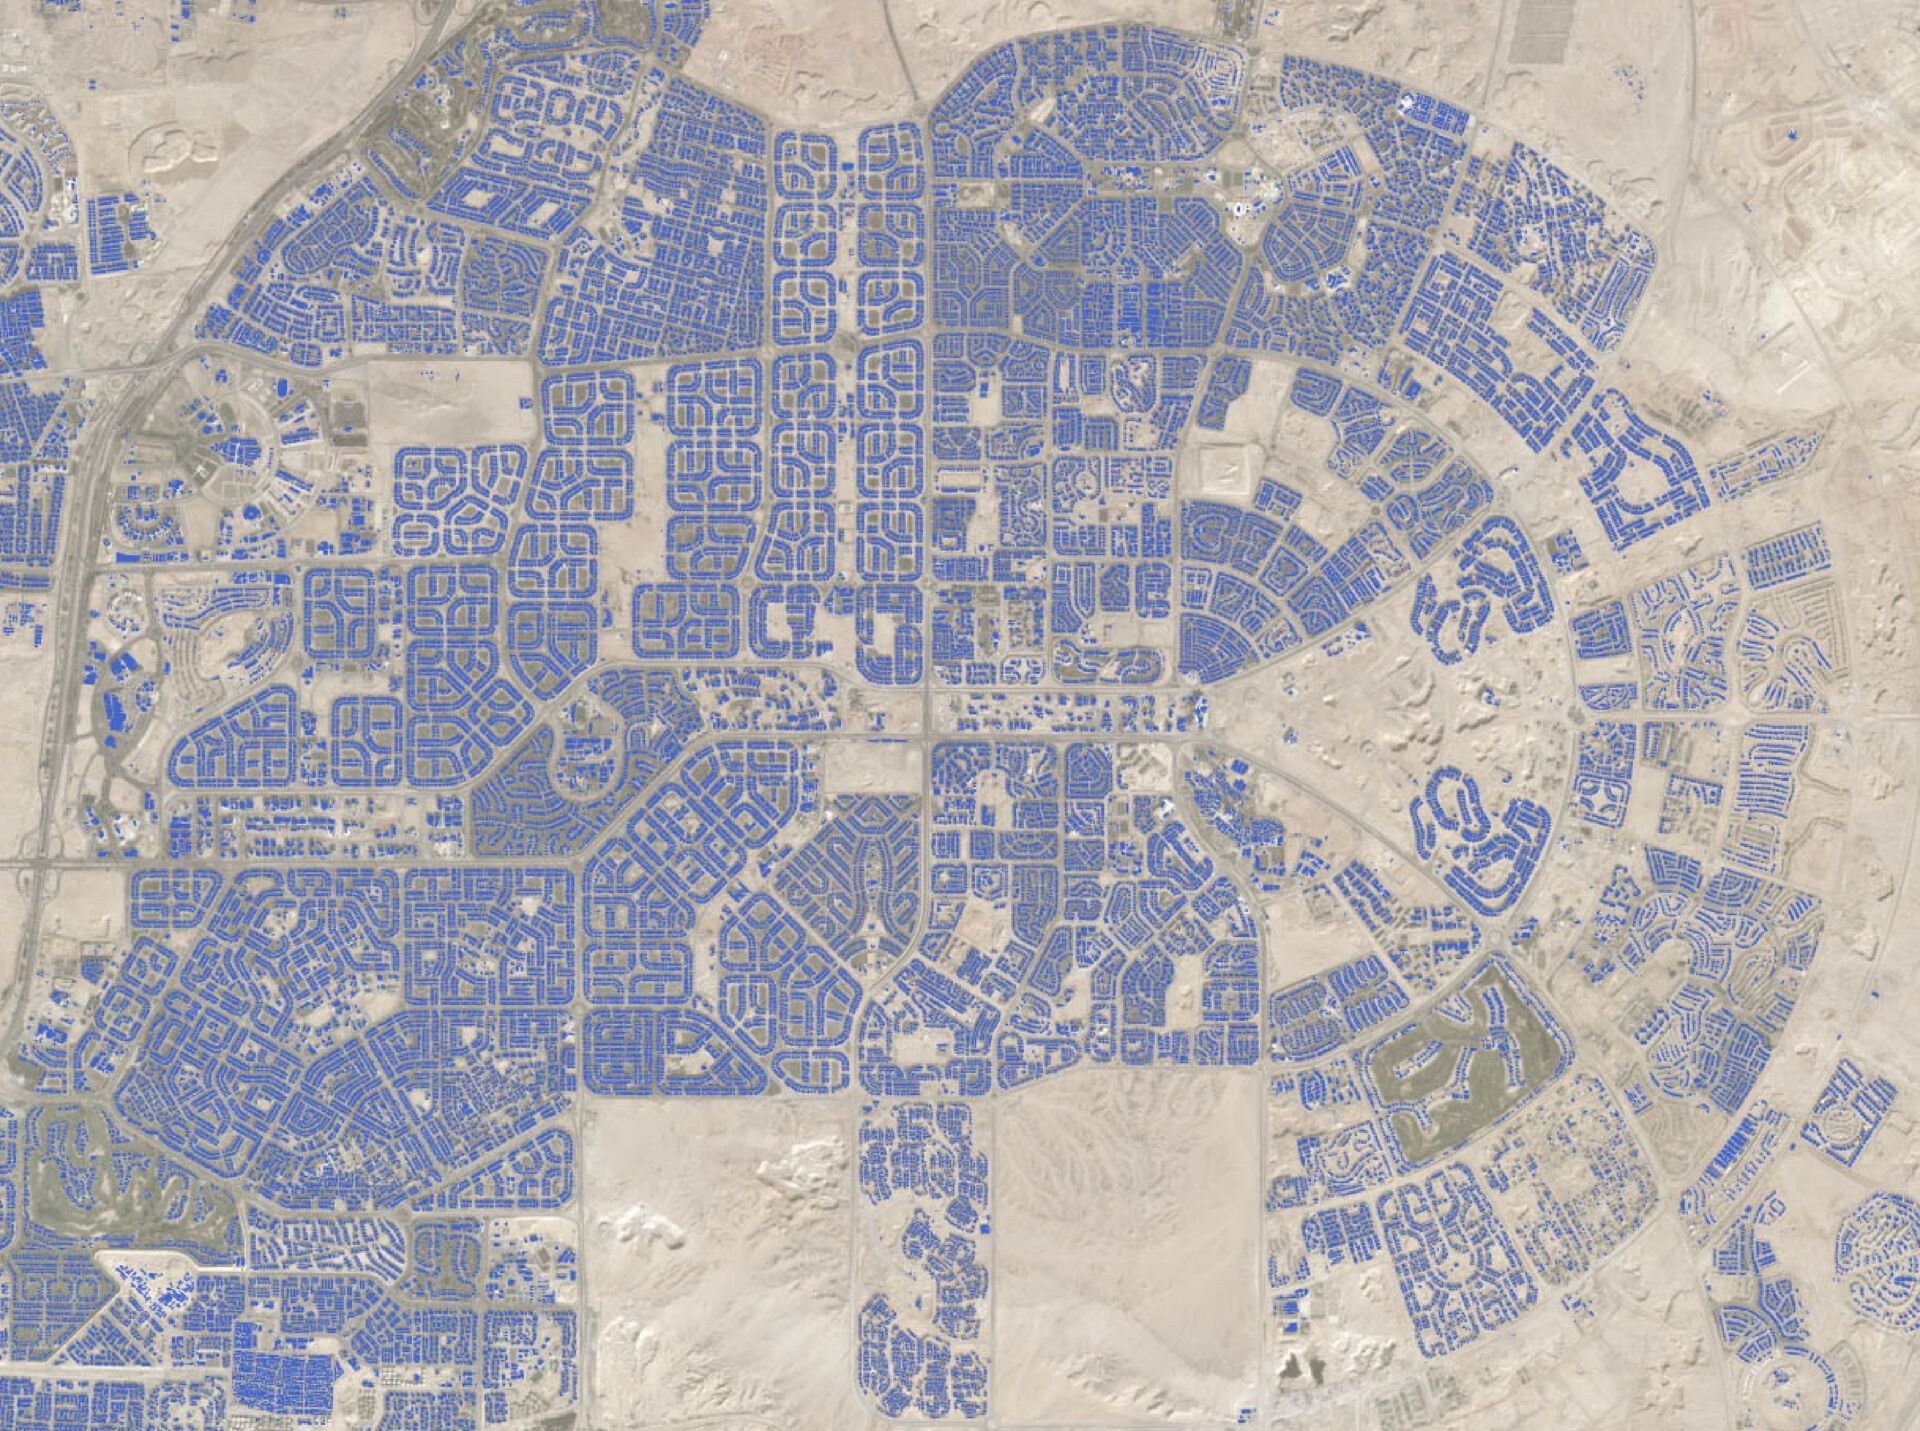
Detection and classification
Buildings, trees, crops, vehicles and land cover detected and classified by machine learning models on satellite imagery.
- 15 cmOptical, enhanced · Vantor
- 30 cmOptical · Vantor
- 3 mOptical, daily · Planet
- 5.3 mHyperspectral · Wyvern
Objects
| Object | Output | Imagery |
|---|---|---|
| Buildings | Footprints, height, new and demolished | Very high resolution optical, stereo |
| Swimming pools | Location and surface area | Very high resolution optical |
| Solar panels | Rooftop and ground arrays, panel area | Very high resolution optical |
| Roads | Centrelines, width, surface | Very high resolution optical |
| Vehicles | Count and type per site | Optical, 15–30 cm |
| Aircraft | Count and type per airfield | Optical, SAR |
| Trees | Crowns, count, height, species groups | Very high resolution optical, hyperspectral |
| Crops | Crop type and condition per parcel | Optical time series, hyperspectral, SAR |
| Land cover | Classes per pixel or per parcel | Optical, SAR |
Applications
- 01
Unauthorised construction
Buildings and extensions missing from permits and the cadastre.
- 02
Property records
Pools, solar panels and extensions against declared property.
- 03
Urban trees
Tree inventory, canopy cover and species per street, park and district.
- 04
Forests
Species groups, dieback and fuel load.
- 05
Crop monitoring
Crop type and condition per parcel through the season.
- 06
Site activity
Vehicles, aircraft and equipment counted over time.
Workflow
- 01
Imagery
Archive or new tasking over the area
- 02
Classes
Defined with the customer, examples labelled
- 03
Training
Models tuned to the area and the classes
- 04
Detection
Objects and classes extracted over the whole area
- 05
Validation
Accuracy checked against reference samples
Change between dates
- 01
New buildings and extensions
Footprints present on the later date and absent on the earlier.
- 02
New pools and solar installations
Listed per property or block, with area.
- 03
Tree loss
Crowns removed, per street, park or forest stand.
- 04
Land cover change
Area moved between classes, with statistics per administrative unit.
Service
- 01
Single delivery
One area, one date, the classes you need.
- 02
Monitoring
Repeat collection, with change reported between dates.
- 03
Integration
Models run on your imagery or inside your platform.
Users
- Municipalities
- Cadastre and mapping agencies
- Tax and property authorities
- Forest services
- Paying agencies
- Utilities and telecoms
- Insurers
- Urban planners
Sensors
Delivery
- Objects
- GeoPackage, GeoJSON, Shapefile
- Class maps
- GeoTIFF, Cloud Optimized GeoTIFF
- Statistics
- CSV per parcel, block or municipality
- Online
- Layers in MyView, API